

Trend Navigator & VIP Oscillator™
Unlock Superior Trading Success with the Trend Navigator & VIP Oscillator™ – Your Ultimate Tool for Market Success.
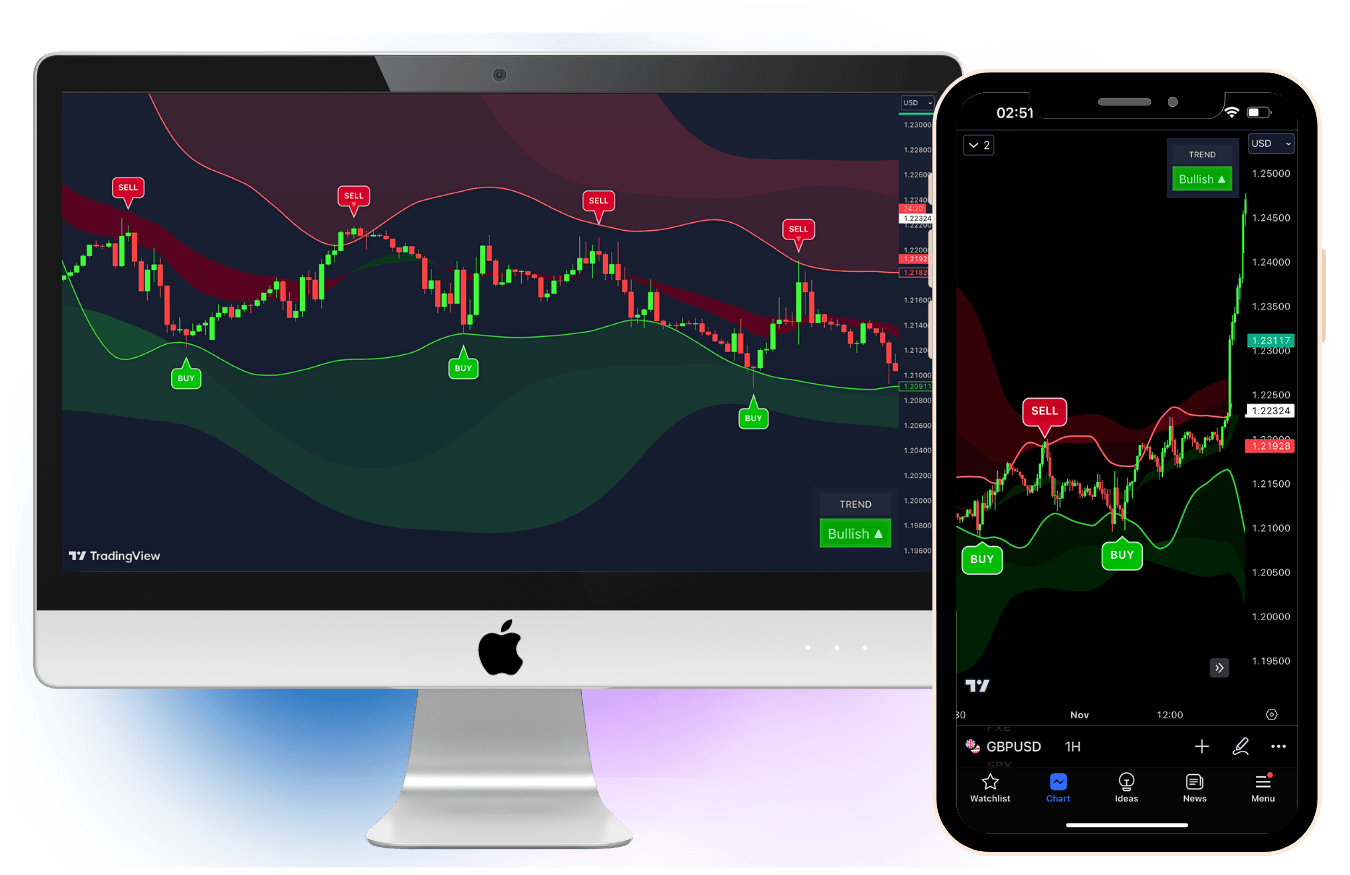
Step into the world of Expert Trading with the Trend Navigator & VIP Oscillator™. This powerful tool is a game changer in the world of trading, offering you a profitable advantage. Every shift in the market becomes your opportunity to make money. More than just an indicator, it's a revolutionary approach to trading, helping you take your trading to the highest level of success.
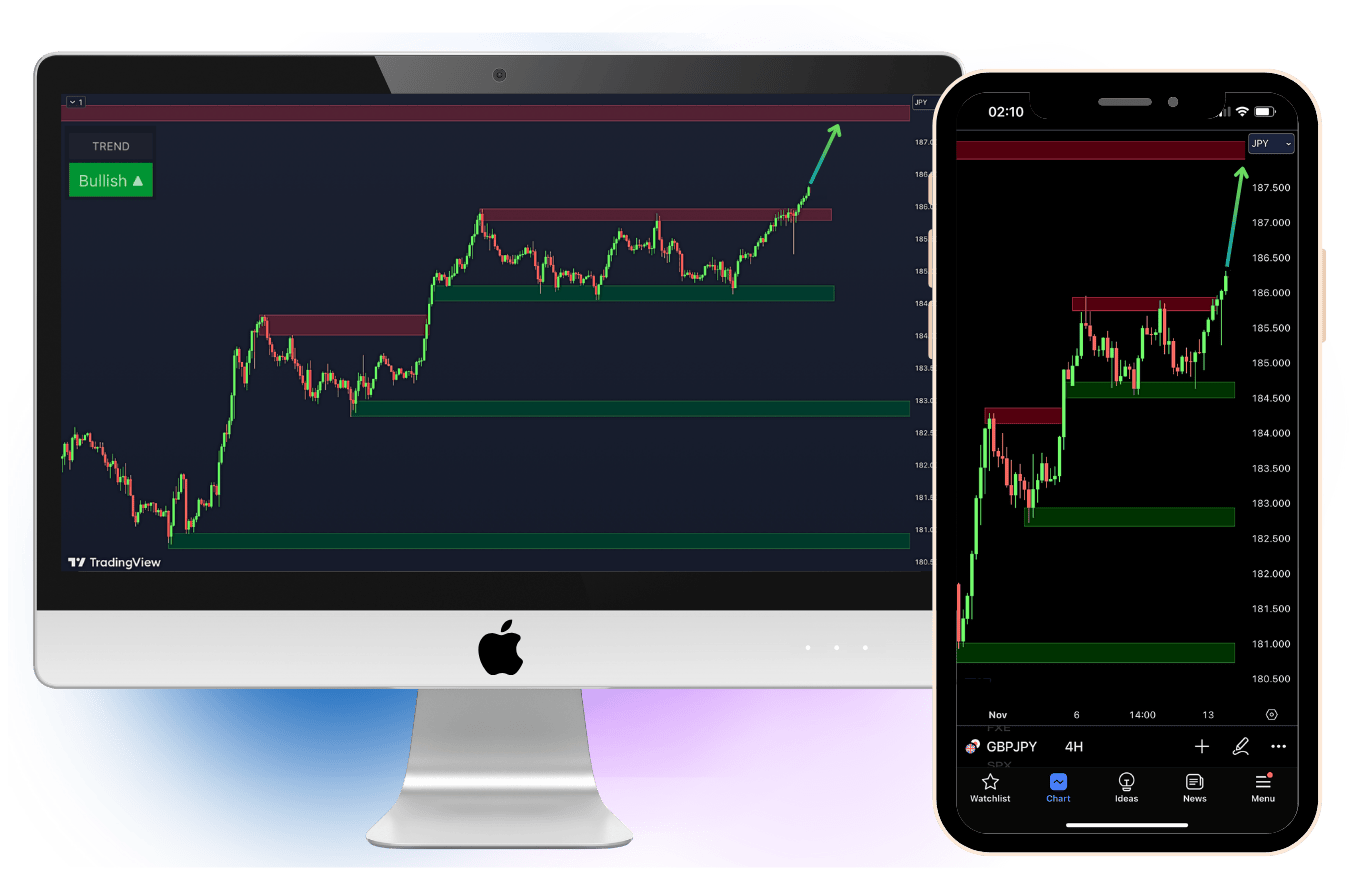
Feel the thrill of trading with unmatched precision. The Trend Navigator & VIP Oscillator™ is your essential trading tool with an easy-to-use interface, state-of-the-art trend analysis detector and a very high winning rate allowing you to grow your trading account. It effortlessly guides you through market trends, showing you precisely when to buy or sell live everyday 24/hrs.
This exceptional tool is constantly at work for you, renowned for its accuracy in identifying profitable trade opportunities. It lights the way in your trading journey, whether you're planning short-term trades or looking at the bigger picture. Even if you're new to trading, this tool is incredibly user-friendly, making it a perfect choice for anyone with its simple buy and sell alerts. The Trend Navigator & VIP Oscillator™ is not just a trading tool; it's your roadmap to confident, successful trading. Embrace this powerful tool and unlock your full trading potential, navigating the markets with proficiency and ease.
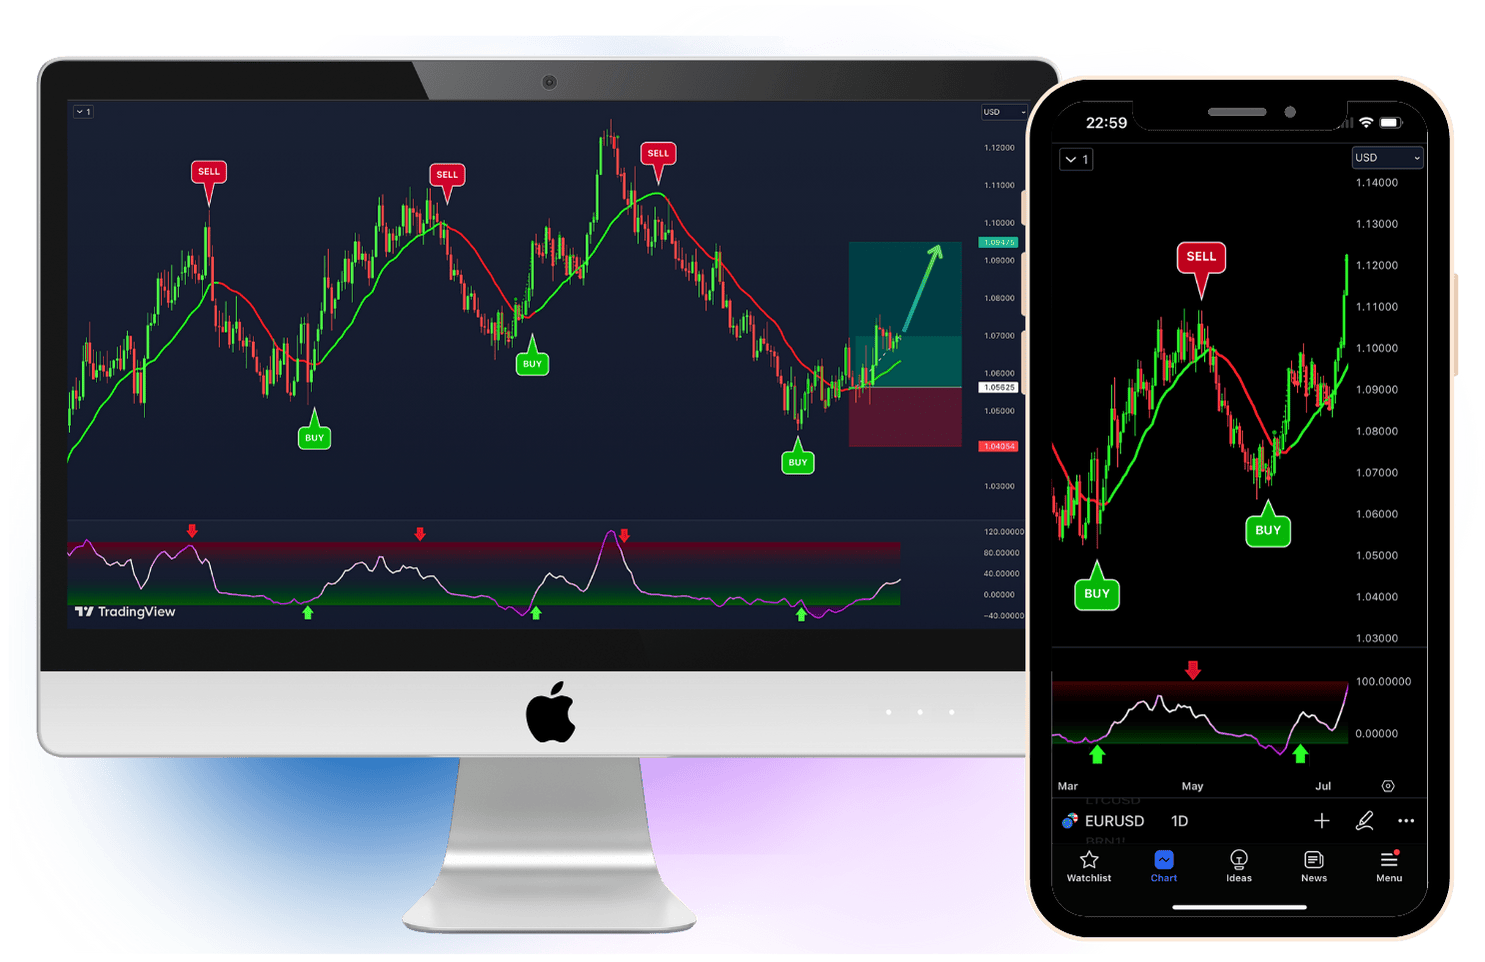
Introducing The Trend Navigator & Oscillator:
Watch The Trend Navigator & Oscillator In Action:
Key Benefits Of The VIP Trend Navigator & VIP Oscillator™
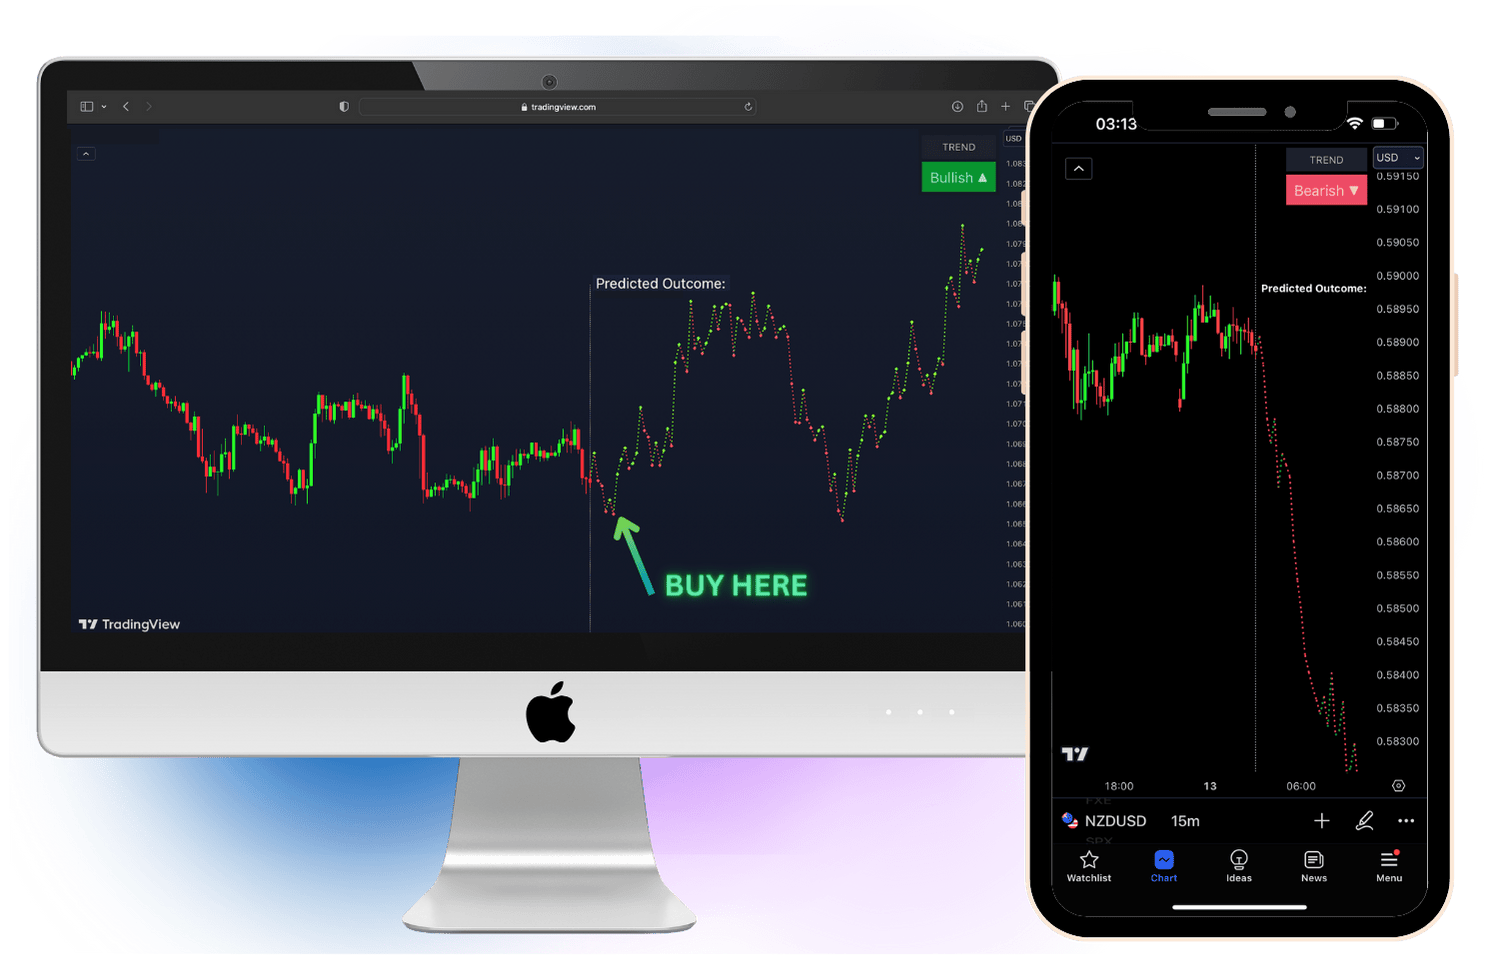
Demo Example Of The Indicator In Action
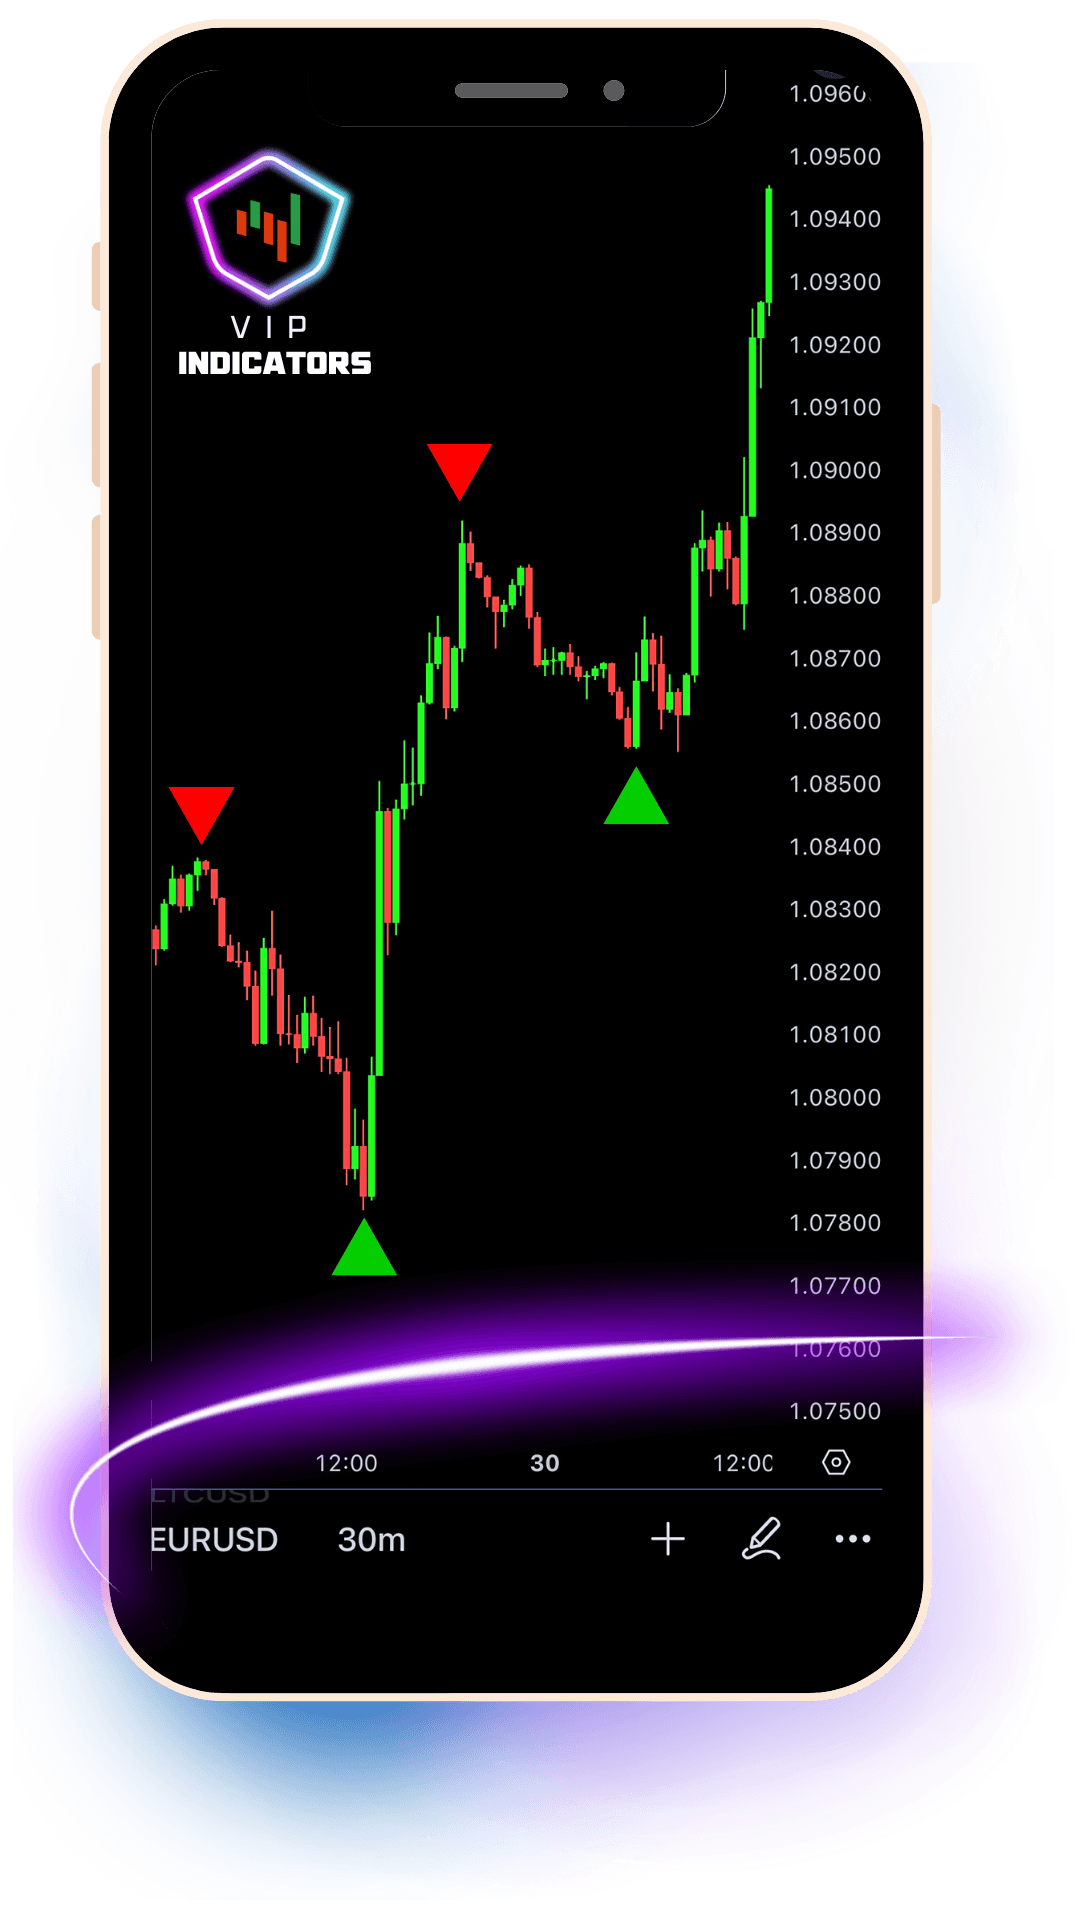
This is an example of the VIP indicator attached to USDJPY on the 1 hour time frame.


How To Use
The settings for the indicator are best left as default. We created the indicator in a very specific way which does not require you to change anything and rather leave it run in its most profitable potential.
The VIP Trading Indicators Are Very Profitable
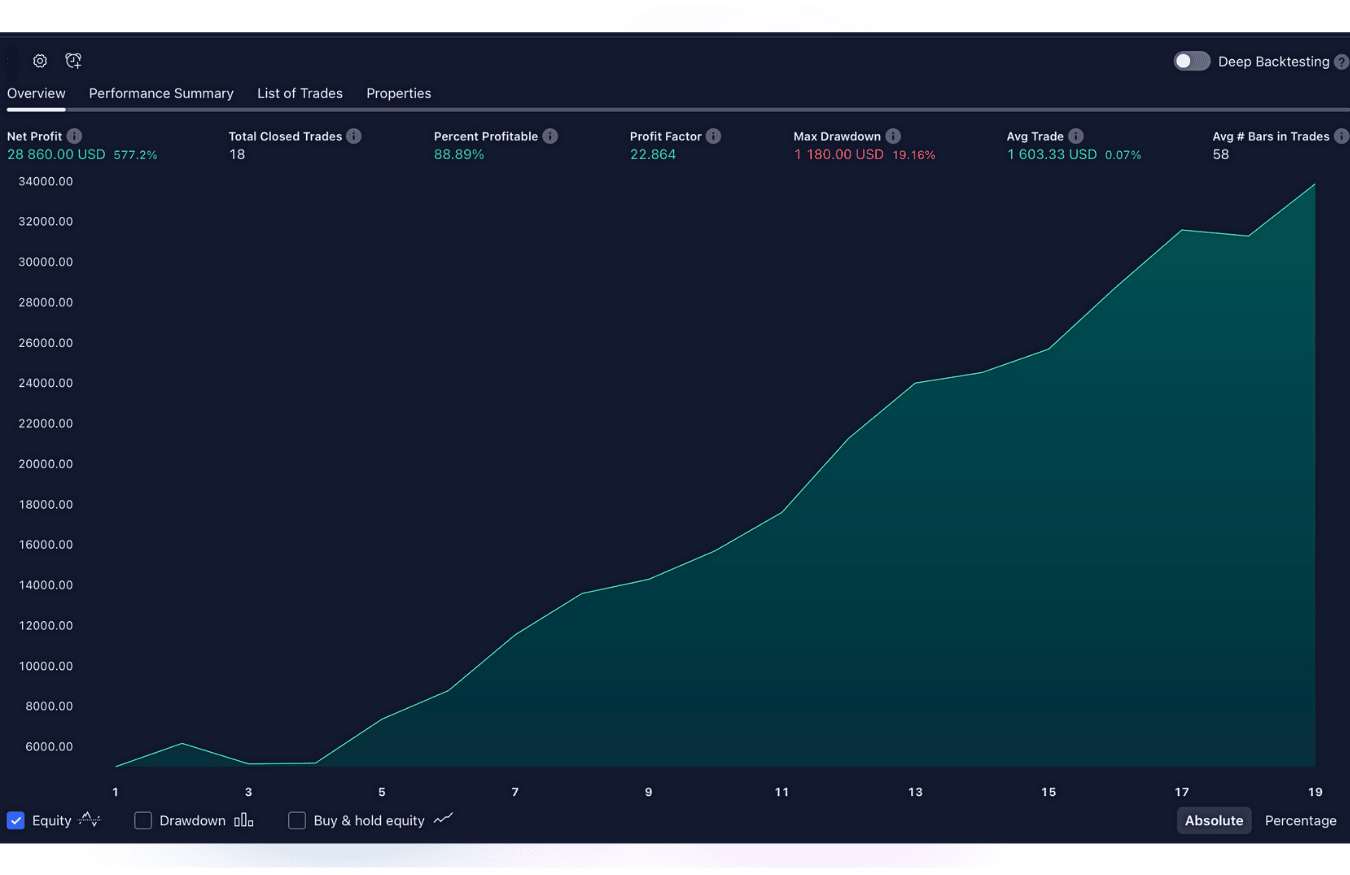
Live Trading Results :
VIP Indicators Win Rate: 93.2%
Number Of Trades Taken: 6498+
Number Of Winning Trades: 6063
Active Indicator Members: 126,503
Average Member Profit: $425/ Day
VIP Indicators Win Rate: 93.2%
Number Of Trades Taken: 6498+
Number Of Winning Trades: 6063
Active Indicator Members: 126,503
Average Member Profit: $425/ Day
VIP Indicators Can Make You Profit On A Daily Basis Up To 93% Of The Time
The VIP trading Indicators are designed to help you grow your trading account balance in the short and long term. The more you use our indicators, the more you can expect to grow your account.
FAQ
Below are some frequently asked questions:
How Can I Get Started?
You can simply get started right now by clicking HERE .. Once you have paid and purchased the deal, you'll get direct access to all the 5 profitable VIP indicators instantly. Once you have paid you will get redirected to the page which gives you access to everything. You will also get an email with the link to your products.
How Does It Work?
Once you have purchase the vip indicator deal, you will be able to get access to the indicators and add them to your charts on TradingView. Adding the indicators to your chart is very simple and we have tutorial videos for members on how to use the indicators and add them to your chart. Our indicators work on the Tradingview app which is a free trading chart platform for any device (You can create a free TradingView account HERE). Once you have added an indicator to your chart, you'll be able to use it in full detail as well as getting buy and sell alerts which will help you find the most profitable trades for the day. You will also be able to join our private telegram group with other members where you will see live alerts and profitable opportunities on a daily basis. If you have any issues you can contact us at [email protected]
Can A Complete Beginner Use Our VIP Indicators
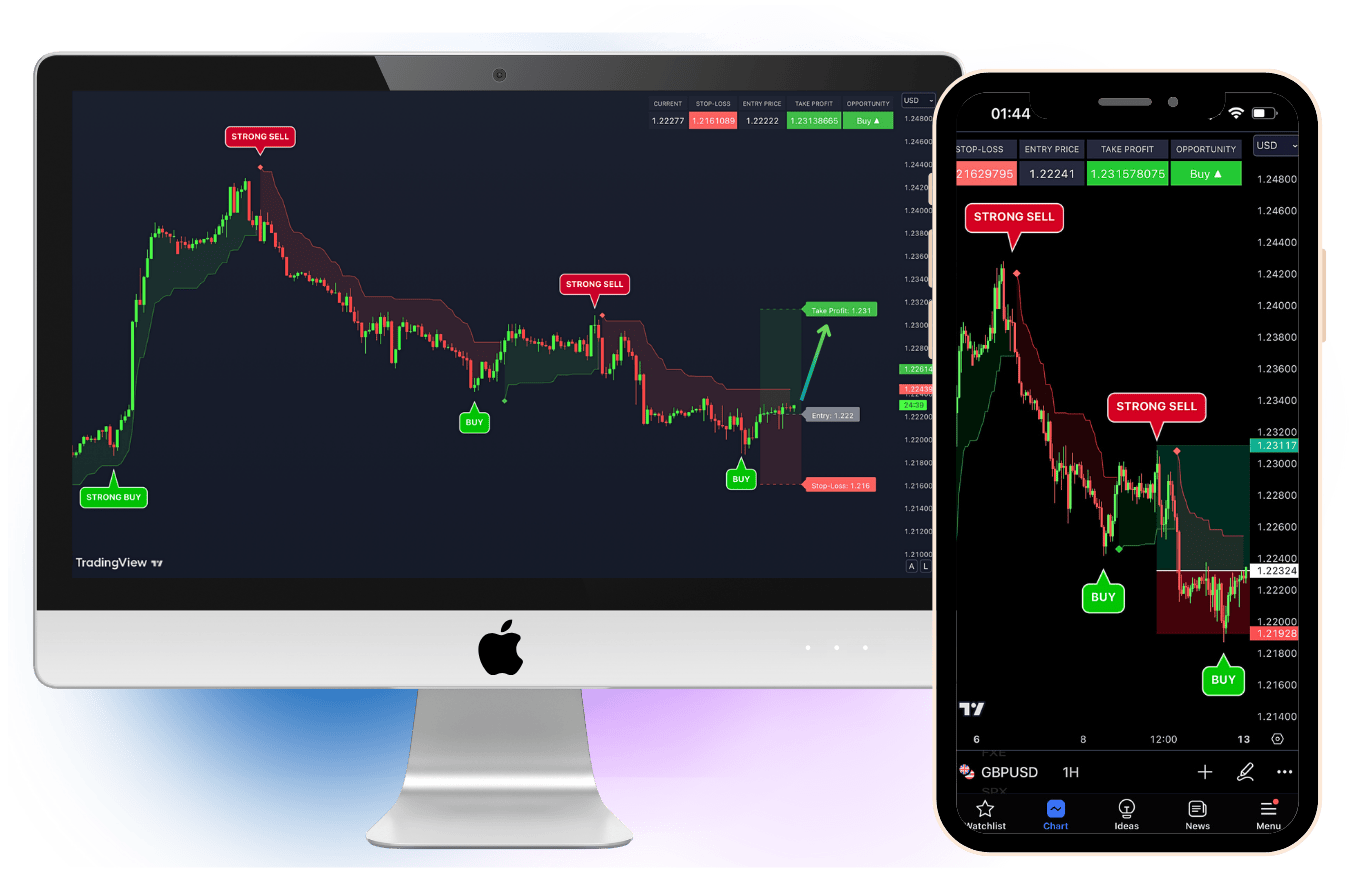
Yes, 100%! All of our trading indicators are extremely easy and very simple to use. The indicators do all the complexed work for you and simply tell you where to buy, where to take profit and where to place your stop loss. We also offer new members free help / support with getting set up and creating an account to take your trades with and everything else. Even if you can't read the charts, our simple & powerful VIP Indicators will tell you when to buy and where to take profit, finding you profitable market opportunities 24/Hrs per day
What Markets Do Our Indicators Work With?
VIP Indicators work on any market available on TradingView. The Indicators also work on all timeframes including 1m, 5m, 30m, 1H, 4H, 1D, etc.
The Trading indicators that we provide can work for any style of trading, whether it is short term daily or long term trading, our indicators work for all types.
How Accurate Are The VIP Indicators?
On average, the VIP indicators can make profit up to 93% of the time. This is based on years of backtesting by our team and customers.
What Do You Get After Purchasing?
You'll receive all the 5 most profitable VIP trading indicators + You'll get to join the private telegram group.
Ready To Get 24/7 Access To Some Of The World's Most Profitable Trading Indicators?
VIP Indicators Are Designed To Make You Profits.
Get Access To 5+ Of The Most Powerful VIP Indicators
VIP Indicators Work For All Different Trading Markets & All Time Frames
VIP Trading Indicators Are Easy To Use And Find You The Best Trading Opportunities 24/hrs
You'll Get 24/7 Live Support From Our Expert Team With Getting Set Up + Tutorial Videos On How To Use Each Indicator

Weekly average profit for the VIP members:
: $2850+
Average profit made by taking an indicator signal:
: $390+
Using the VIP indicators can be one of the best ways for any type of trader to grow their account. Using VIP indicators is one of the fastest ways to grow!
VipIndicators.com - COPYRIGHT © 2024 - ALL RIGHTS RESERVED
We Do NOT offer any Investment advice or COPY TRADING services whatsoever. The indicators are used only for educational purposes.
By using our currency chart you acknowledge that we are not providing financial advice.
Charts used on this site are by TradingView in which our indicators are built on. TradingView® is a registered trademark of TradingView, Inc. www.TradingView.com. TradingView® does not have any affiliation with the owner, developer, or provider of the products or services on this site.
Trading involves high risk, and a majority of traders incur losses. The information and services provided by VipIndicators.com on this site are purely for educational and informational purposes. All content should be viewed as hypothetical and is presented post-event to illustrate our product. It should not be interpreted as advice. Decisions regarding buying, selling, holding, or trading carry risks. These decisions should ideally be made with guidance from qualified professionals. Remember, past success does not ensure future performance.
No claims are made that any account will, or is likely to, achieve profits or losses similar to those discussed.
CUSTOM JAVASCRIPT / HTML